
Impact dashboard
Numbers should explain the story, not replace it.
Our impact model tracks reach, quality, allocation and follow-through across programs.

Impact is a chain, not a single metric.
91%86%94%

Field evidence
Watch the work behind the numbers.
Program metrics are checked against field observations and partner reporting.
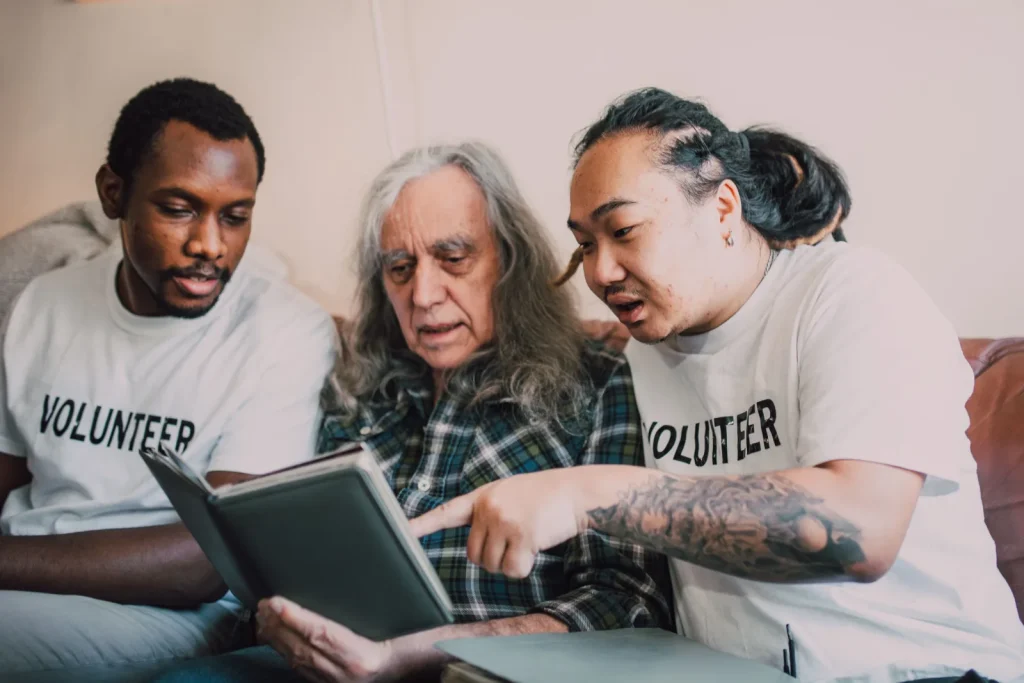
household support interactions

students supported
Quality checks after delivery.
96% delivery verification
88% follow-up participation
4.8/5 partner satisfaction

Case note
A food program that became a school attendance story.
When household food pressure eased, school attendance stabilized for participating families.
How we measure
- Baseline
- Delivery evidence
- Partner review
- Participant follow-up
- Public summary